Floating waterwheel

Project overview: During my MEng, I teamed up with a multidisciplinary group to tackle a unique energy problem: how do you generate off-grid, sustainable power for rural farming communities using low-flow irrigation canals? Our solution was a floating kinetic waterwheel. By designing it to block most of the canal width, we created a localized head difference. This neat trick let us extract both kinetic and gravitational potential energy from flows that are usually too weak for traditional power generation.
Mechanical design & rapid prototyping: We built a half-scale, flat-packable prototype designed for low-cost transport. I had to carefully balance performance, cost, and manufacturability. We chose aluminium blade arms for their low weight and corrosion resistance, adding vertical stiffeners to the frame to stop it flexing under heavy load. The real game-changer, though, was having my own 3D printer. I could design custom parts—like a reinforced high-friction shaft clamp to fix drivetrain slip, or quick-change magnet mounts for our RPM sensors—print them, and test them on the flume that exact same day.

Electronics & data handling: The electronics needed to be flexible so we could adapt as we learned. The brains of the operation was an Arduino Nano ESP32 hooked up to a high-accuracy power sensor, an IMU, and a waterproof hall-effect sensor for speed. I set up a unified codebase logging everything to JSON, making it super easy to swap sensors in and out without breaking my analysis scripts. We even set up wireless live plotting, which was a lifesaver—we could actually see the voltage drop from a slipping drivetrain on our laptops before we could physically see it happening on the wheel.

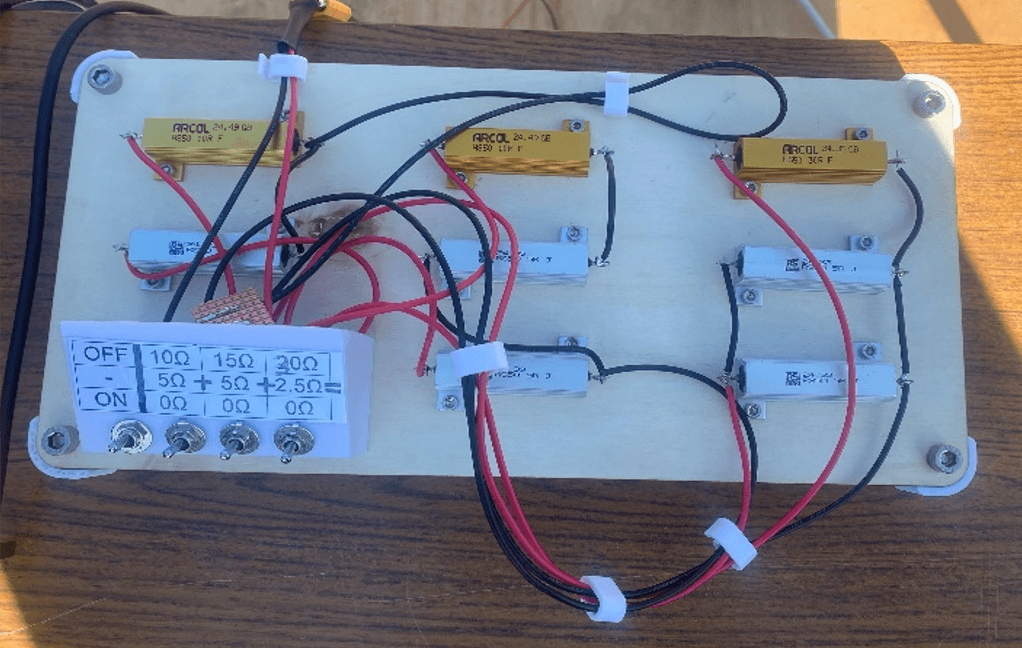
Testing and problem-solving: Flume testing at the Chilworth facility was intense, and we had to think on our feet. When our original resistor switchboard blew, we managed to design and build a replacement in under 24 hours to keep the momentum going. Ultimately, the experiments proved our core hypothesis: the design delivered significantly more power than the canal's kinetic energy alone would suggest, proving it has real potential out in the field.